Paper summaries with the key figures
Ask Althea to summarize a paper and it reads the whole thing, then replies with the key figures and the key ideas.
Every figure in the reply links back to the exact spot in the source PDF, and the summary can go on by email or WhatsApp.
Worked example: gravitational-wave parameter estimation
Asked to summarize arXiv:2512.02968 (DINGO-T1, transformer-based gravitational-wave parameter estimation), Althea returned a structured summary: the contribution overview, the methodology with the original architecture diagram intact, and per-event results as a formatted table, 48 real gravitational-wave events with detector configurations and sample efficiencies side by side. In much of physics, the figure is the result. A paragraph describing a posterior distribution is a poor substitute for the plot.
- The authors integrate a transformer encoder into the DINGO framework for Neural Posterior Estimation (NPE). The approach treats gravitational-wave data analysis as a sequence processing problem.
- 1. Tokenization: Data from detectors (Hanford, Livingston, Virgo) is compressed and partitioned into "tokens." Each token represents a specific frequency band from a specific detector, embedding both the strain data and the Power Spectral Density (PSD).
- 2. Transformer Encoder: These tokens are fed into a transformer, which uses self-attention to learn global dependencies across detectors and frequencies.
- 3. Data-Based Masking: A crucial part of the training strategy is "data-based masking." During training, the model randomly drops tokens corresponding to entire detectors or specific frequency bands. This teaches the network to infer parameters even when parts of the data are missing, mimicking real-world scenarios like detector downtime or noise notches.
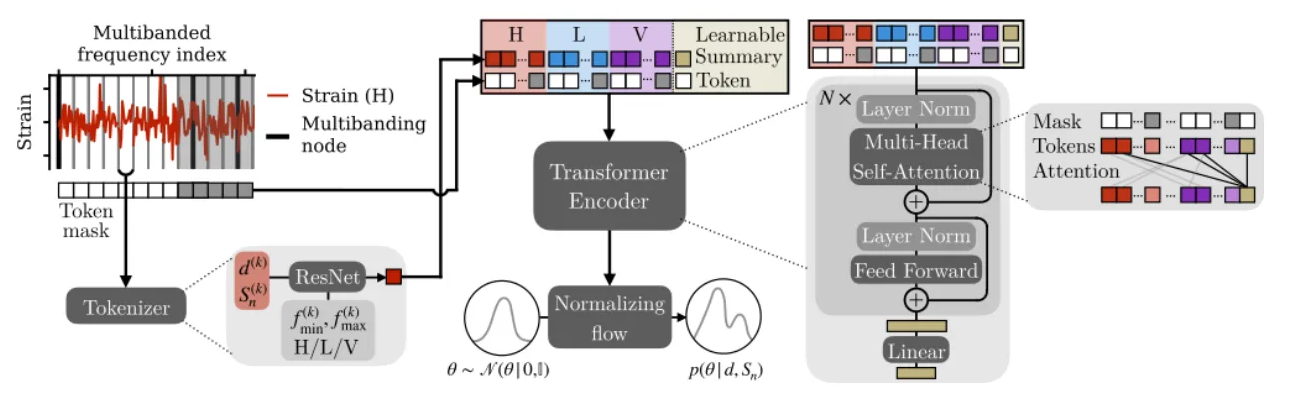 Figure 1: Overview of DINGO-T1
- The model was validated on both simulated signals and real data from the LIGO-Virgo-KAGRA (LVK) third observing run (O3).
- Sample Efficiency: On 48 real O3 events, DINGO-T1 achieved a median sample efficiency of 4.2%, significantly outperforming a baseline ResNet-based DINGO model (1.4%).
- Speed: Inference takes 5–10 minutes for 10⁵ samples, enabling rapid exploratory analysis.
- Generalization: A single trained model successfully analyzed events across 17 different detector configurations without any fine-tuning.
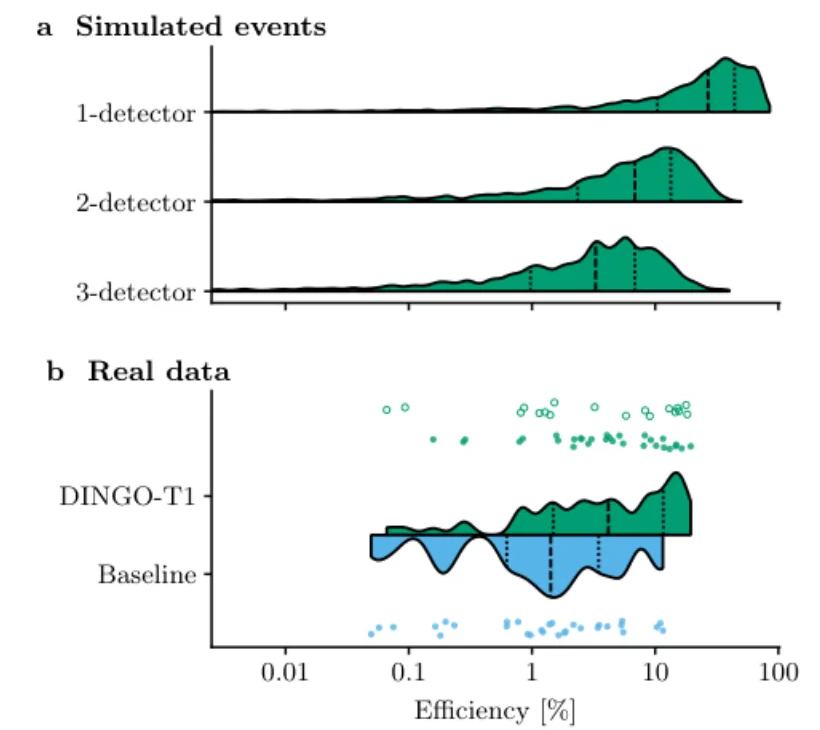 Figure 2: Sample Efficiency DistributionsPanel (b) compares the sample efficiency of DINGO-T1 against a baseline on 48 real GW events, demonstrating superior performance.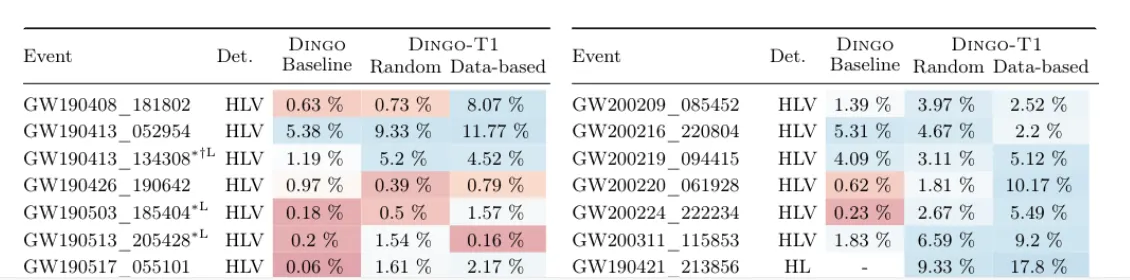
- The flexibility of DINGO-T1 enables physics tests that were previously computationally prohibitive:
- Systematic Studies: Researchers can instantly see how adding or removing a detector changes the parameter estimation.
- IMR Consistency Tests: The model can perform inspiral-merger-ringdown tests to probe General Relativity by masking different parts of the signal frequency spectrum.
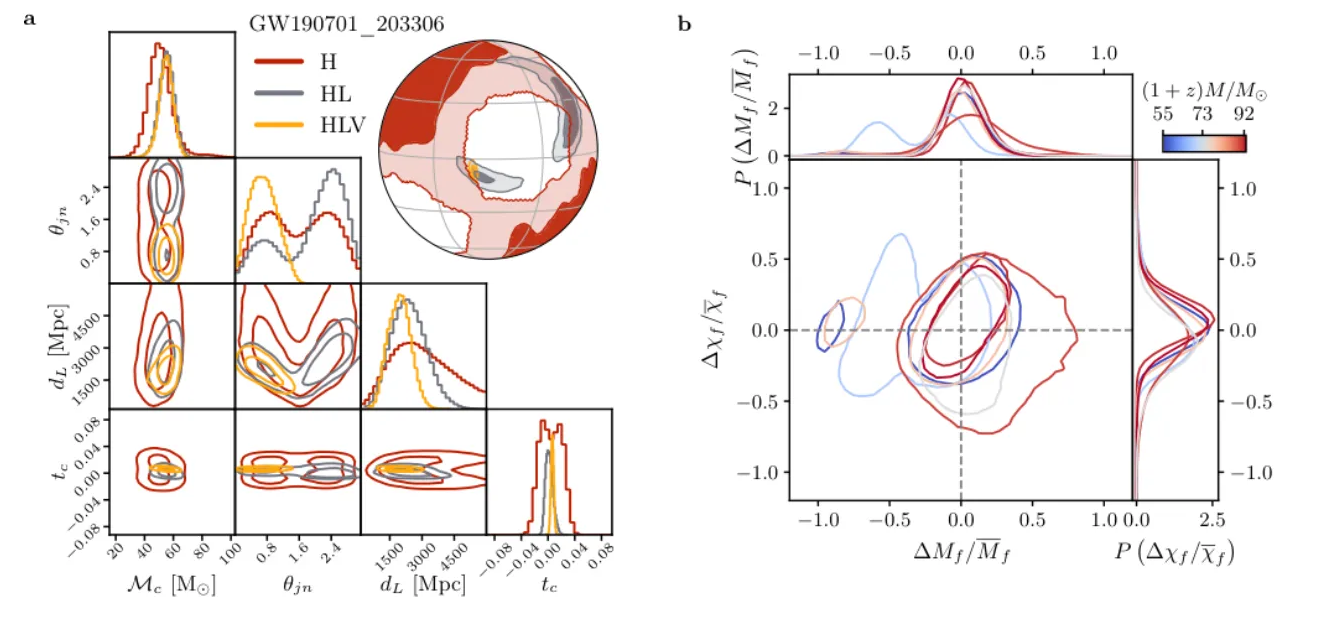 Figure 3: Applications: Posterior Distributions and IMR Consistency TestsPanel (a) shows how the posterior changes as detectors are added (H → HL → HLV). Panel (b) shows results from testing the consistency of the signal with General Relativity.
Summaries vs. widgets
A summary is something you read and cite. When the static plot is not the point and you want to interact with the relationship itself, ask for a widget.
| You need | Ask for | You get |
|---|---|---|
| Something frozen and shareable | A summary | A reply with the paper's figures, source-linked; send it by email or WhatsApp |
| To interact with the relationship | A widget | An interactive page in the chat, with a public link |
After the summary
Once you understand the high level of a paper, you can keep chatting about it, pull in new papers, and make comparisons. When a review needs to stay current for months, pair it with a standing monitor.